Experience + Projects

AI and Data Science Intern
JPMorgan Chase & Co.Consumer & Community Banking (CCB)
Worked in the Consumer & Community Banking division to improve model interpretability by binning loan applicants and hierarchically clustering model features
Maintained an ETL pipeline for Consumer & Community Banking risk records and preprocessed 100 GB of raw consumer records for use across business banking loan models
Used Pyspark and XGBoost to improve the accuracy of our team’s small business loan default model by 12%
- My fourth internship
- Summer 2022
- Duration: 2.5 months
- Wilmington, DE

Summer Research Fellow
Carnegie Mellon UniversityDepartment of Statistics and Data Science
I was selected as part of a 16 person cohort to work on research in statistics and data science at Carnegie Mellon University.
Advised by Dr. Kostas Pelechrinis, Professor int he Information Science department at University of Pittsburgh, and author of 'Mathletics'. I contributed to a first of its kind analysis to predict expected goal count in soccer by using stochastic game dyanmics
Built a web application backend using Python integrated with a Javascript frontend to enable users to pit two soccer teams against one another and visualize the outcome of a match
- My third internship
- Summer 2021
- Duration: 2 months
- Pittsburgh, PA

Data Science Intern
Rolls-Royce North AmericaCivil Aerospace
Built an algorithm to identify when a Rolls-Royce AE3007 engine has reached its optimal compressor wash interval
Mapped 500K datapoints of Rolls-Royce engines to public commercial flights (across a 5-year span) to create a 1:1 engine to plane relationship when geospatially visualizing flight paths
Reduced the hours required to recognize which flights require compressor wash from 3-4 hours to less than 5 minutes by deploying a R Shiny application that structures, visualizes, and pinpoints hundreds of at-risk planes in real-time
- My second internship
- Fall 2019 - Spring 2020
- Duration: 10 months
- Remote

Information Security Intern
LPL Financial Holdings, Inc.Cybersecurity
Visualized and investigated data transfer cybersecurity risk from company 3rd party vendors
Cleaned 87 MB of LPL user portal data with Python and transformed cataloged logs into multiple workable data frames to identify instances of malicious access on the company website
Presented a risk assessment report to senior executives highlighting frequent gaps in data privacy regulations
- My first internship
- Summer 2019
- Duration: 3 months
- La Jolla, CA
Make-A-Monet
UCLA DataResLink
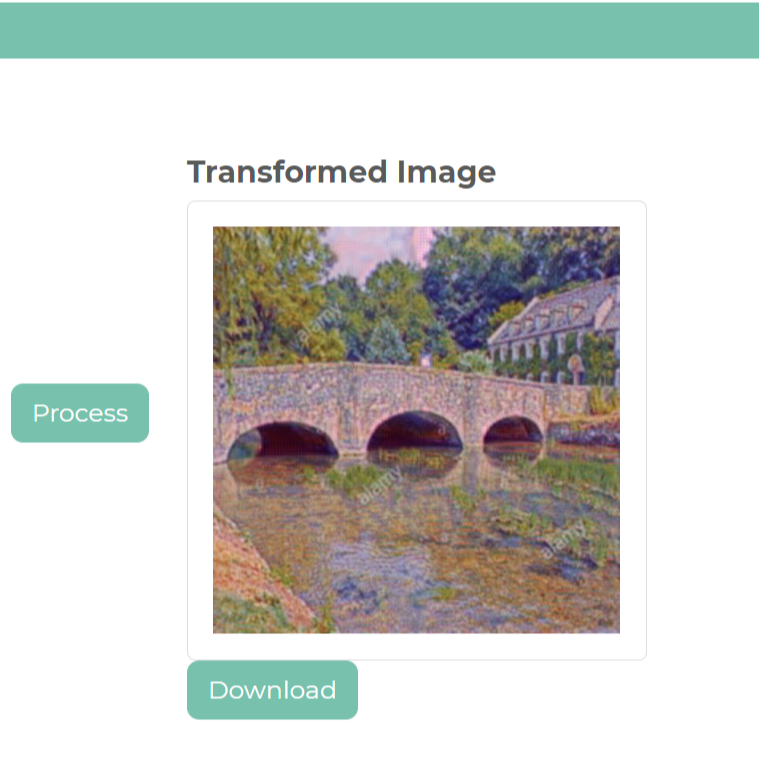
I worked on creating an application to convert everyday images (such as nature scenes) into paintings
Using Pix2Pix and Cycle GAN architecture we were able to achieve image style transformations to generate "Monet-esque" paintings from user input.
To make our application user-friendly we hosted our work using Heroku and built our front-end with the Plotly-Dash framework.
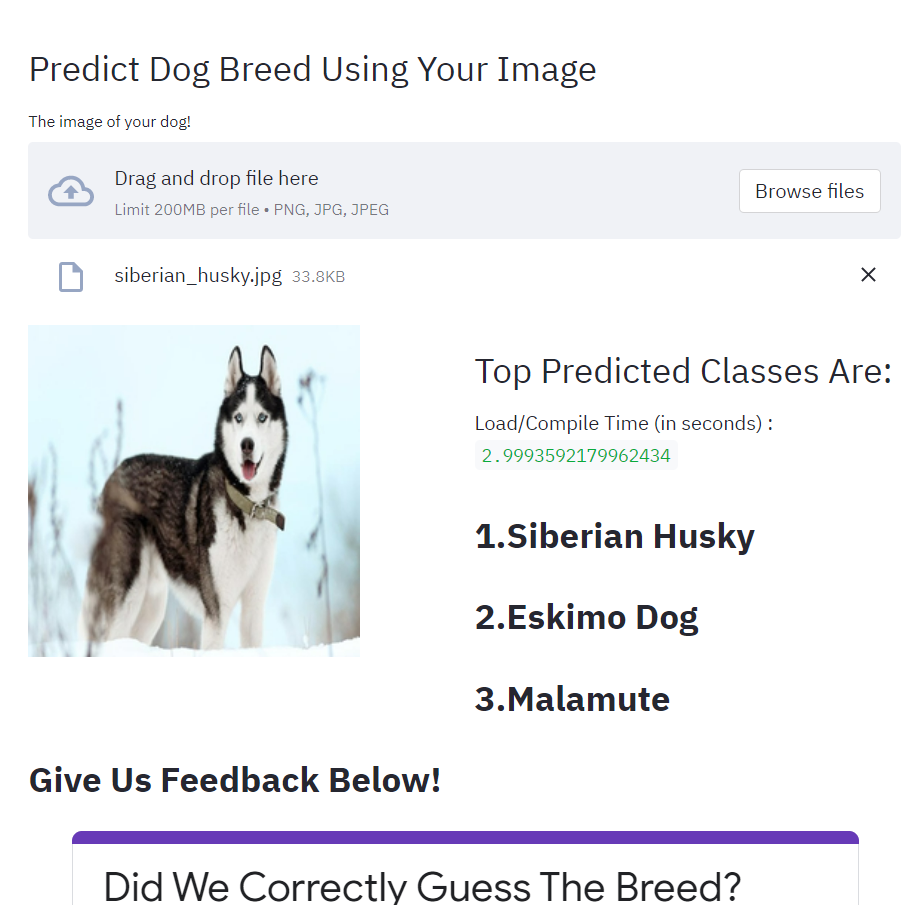
Dog Breed Predictor
Using TensorFlow I created a web application with the goal of predicting a dog's breed using an image.
Capable of predicting 121 dog breeds, this web app is built with the help of Inception v3
On top of the breed clasifier, I also created a page within the web app dedicated to recommending dog breeds to a user based on owner-preferences (i.e. amount of maintenance, dog size, ability to be trained).
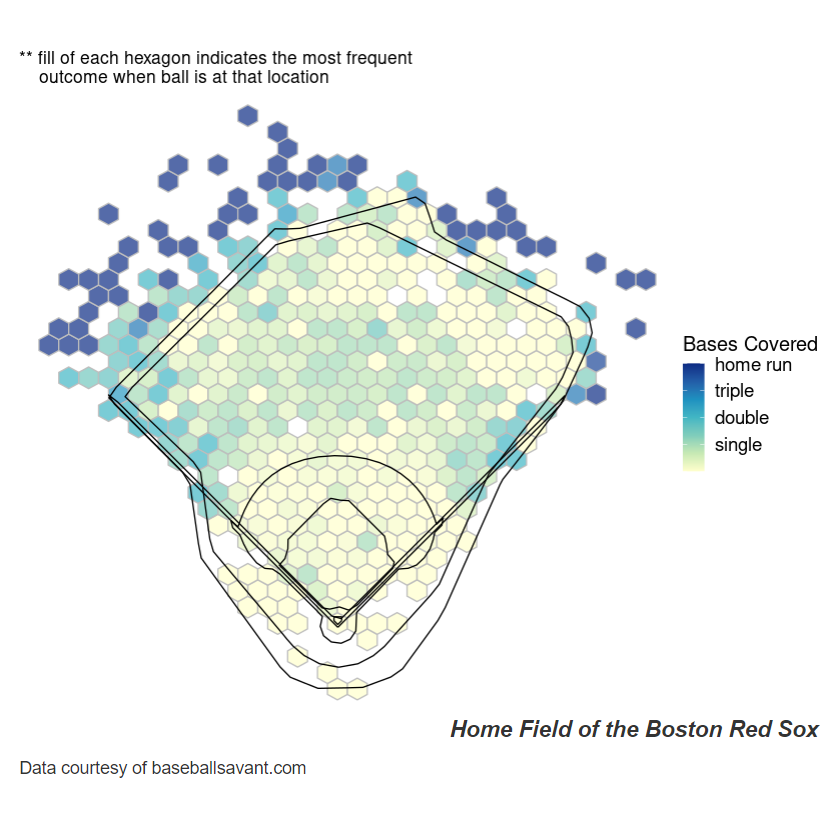
Variability In Baseball Stadiums
LinkAmong baseball enthusiasts there is a prevailing theory that the dimensions of a baseball stadium affect batting statistics.
Nowhere is this more true than with The Green Monster - the left field wall at Fenway Park that is famous for preventing home runs on many line drives that would clear the walls of other ballparks.In order to investigate trends like these, I use R Shiny to visualize how hit distance, effective speed, launch speed, and bases covered vary between all major baseball stadiums in the United States.

A Comprehensive Analysis of COVID-19 Vaccine Rollout
UCLA DataResLink
I led a team of three other students to investigate vaccine rollout across the nation. By investigating vaccine success state-by-state, we aimed to explain the disparity across the country.
I used Facebook's Prophet library to look at different milestones concerning vacccination success, including President Biden's 100-day plan.
On top of the analysis of vaccine rollout, I also used NLP to interpret the twitter sentiment surrounding different COVID-19 vaccines, international politicians, and other global entities.
Predicting 2021-2022 NBA Salaries
The Data Science UnionLink
I worked on creating a salary predictor for NBA players. Using attributes like a player's position, age, turnover rate, and games played we sought to find out how much a player might make in their next season of play.
After using linear/polynomial regression, support vector machines, and random forest, I landed on using the gradient boosted framework, XGBoost.
I developed a web application, and built the final model by splitting data into Rookie/Veteran groups and running gradient algorithms on different subgroups.
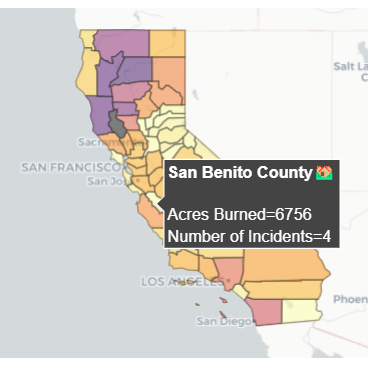
An Investigation of the California Wildfire Crisis
UCLA DataResLink
As project lead, I led a group of five others to create a comprehensive article for DataRes at UCLA.
This article looks at California wildfire growth over the last decade, and the role climate change has played in exacerbating the current wildfire crisis.
I employed a variety of geospatial python libraries in order to best capture the existing patterns and characteristic attributes of California wildfires. All visualizations were created from scratch using CAL FIRE data and APIs.
Forecasting Hot Dog Sales
LinkEvery year, thousands of hot dogs go to waste across Texas due to miscalculation of demand. We sought to help Chevron prevent this by extracting insights into consumer behavior and creating a model that can accurately forecast sales.
We utilized machine learning to create a cook plan for certain buckets of time, saving Chevron money. We acheived a root mean squared error (RMSE) of 3.55 against new data (the lowest RMSE across 45 teams).
This project was completed as part of the 2021 Rice Datathon and my group won 1st place in our category.
Virtual Assistant for the Visually Impaired
LinkIn this project my team built a virtual assistant to convey COVID-19 information audibly and over SMS.
We noticed a gap in catering for those with visual impairments and addressed this issue with the tremendous capabilities of speech recognition.
We essentially created a virtual assistant that can perform a variety of tasks. These tasks range from answering questions about the virus using an AI-powered chatbot, to enabling quick-and-easy dissemination of real-time COVID-19 county-specific updates.
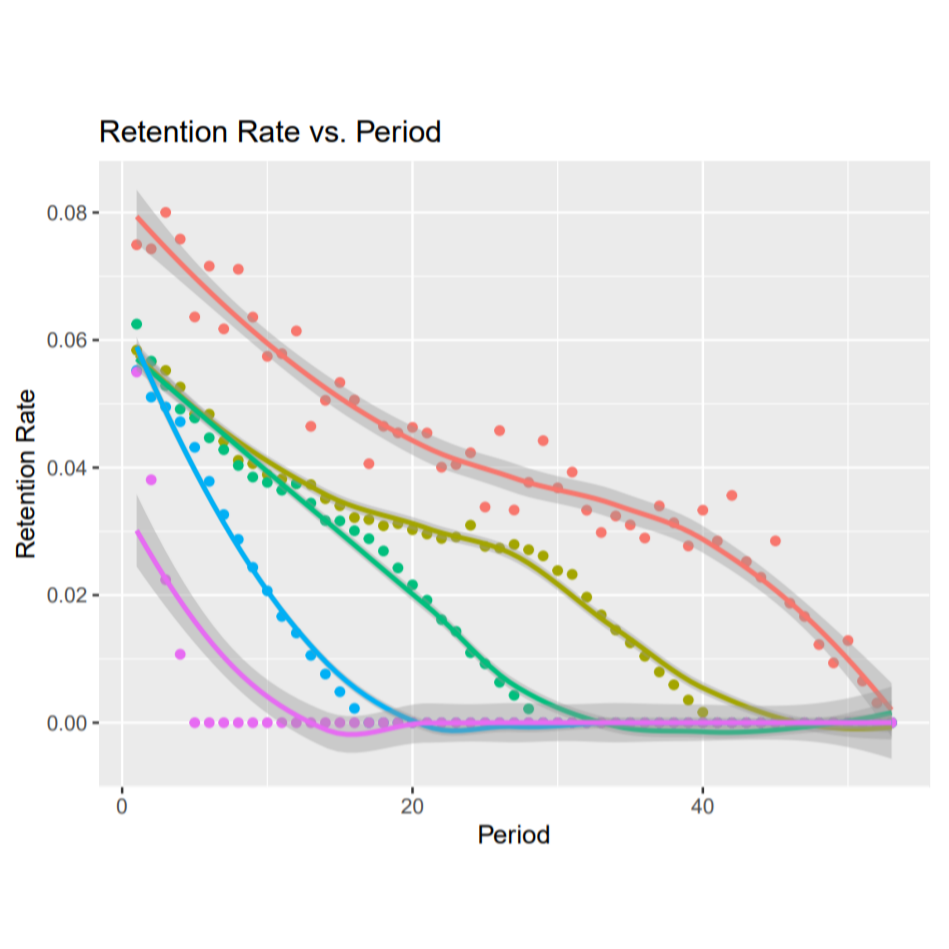
Retina AI Datathon
LinkThe aim of this datathon was to gather eCommerce insights and leverage analytics to diagnose business strengths in terms of customer behaviors.
I was charged with analyzing visualizations that projected customer lifetime value (LTV) over 5 year and 10 year periods.
By analyzing specific quantiles of our subset, I came to the conclusion that my client (the eCommerce company in question) should target higher spenders and incentivize to those customers who fall in the top 60% of high-spenders. I won 2nd place overall.
Research
An Interpretable Method of Learning Stochastic Game Dynamics
- Accepted to the Carnegie Mellon 2021 Sports Analytics Conference [ Conference Link ]
Abstract:
In soccer, modeling expected goals in a match is difficult without the use of player
tracking data. Many models that attempt to make score predictions depend almost
exclusively on the outcome of previous matches, and hence tend to do a poor job of
capturing high score differentials (as in when a team wins by a substantial margin
over another team). Relying on just the tracking data of the ball alone, we wanted
to encapsulate the complex movement and forces acting on the ball into a much simpler
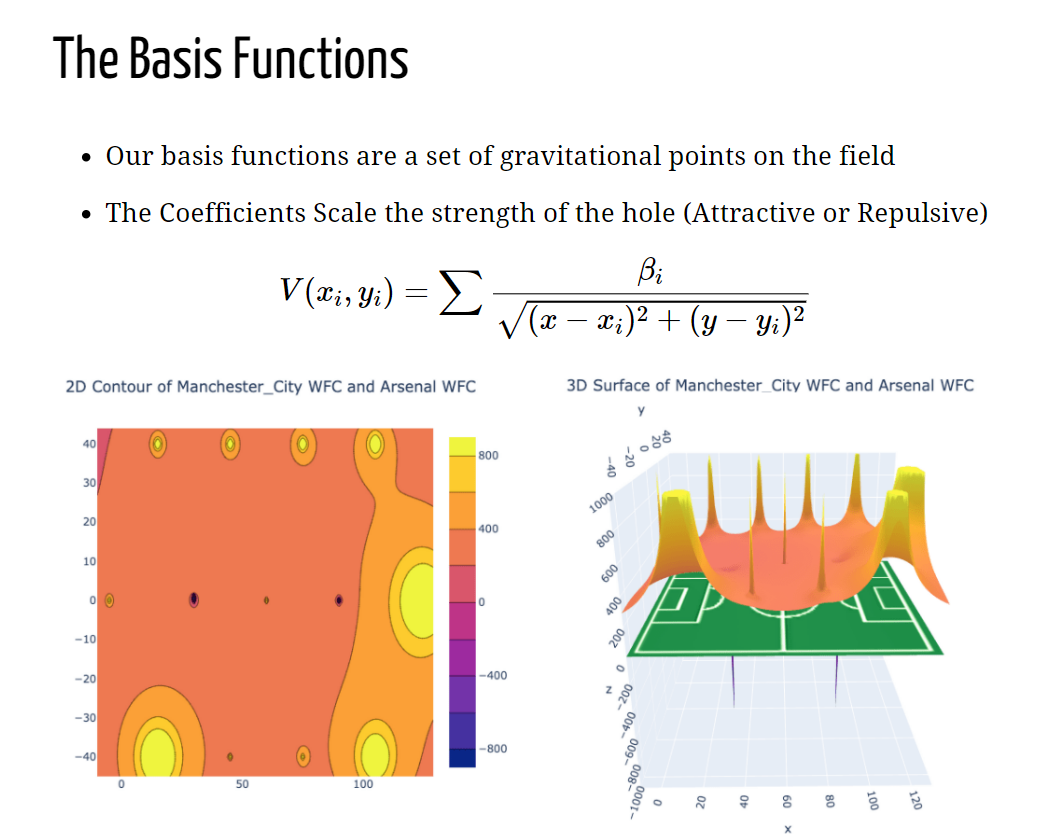
object. This object is the potential function, which is simply an equation used to
model underlying forces (e.g. gravitational potential functions). In a 2007 study,
David R. Brilllinger wrote a paper on how to learn a potential function given a
trajectory. The crux of this paper is that potential functions can be approximated
using basis functions. In our case, these basis functions are a set of gravitational
points, whose coefficients are based on the offensive and defensive movements of our
teams, creating a potential function landscape unique to each team pairing. Through
this “potential function landscape,” we are able to simulate games over time and create
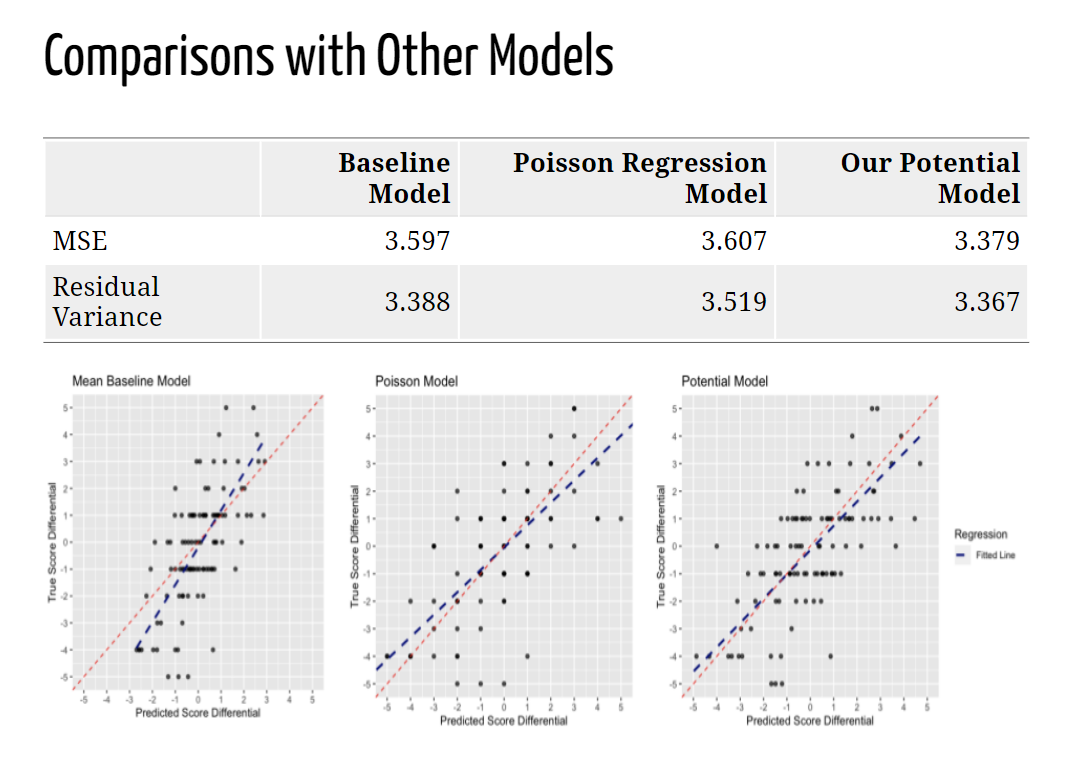
an averaged score prediction when two teams are pitted against each other. What we
found is that predictions formed using this methodology capture high score differentials
more reliably, and reduce both the MSE and residual variance compared to a Poisson
Regression Model. We believe that this new method of modeling expected goals could also
be used to determine player impacts in a game and provide a real-time game evaluation
in the future.